How to Use Keycloak behind Nginx to serve Prometheus and Grafana
Last Updated: Saturday, July 18, 2020
Introduction
This tutorial explores how to install and configure Nginx, Prometheus, Grafana and Keycloak.
In this use case, you want to access Prometheus and Grafana using Nginx as a reverse proxy, using Keycloak to provide user’s authentication.
You will install all the services in virtual machines, one service per each vm. I choose to not introduce container or kubernetes complexities into this exercise.
I assume you already know how to setup a virtual machine.
For this tutorial, the VMs are running at the following addresses:
192.168.56.3	prometheus
192.168.56.4	keycloak
192.168.56.5	grafana
192.168.56.6	nginx
192.168.56.7	ca
192.168.56.8	o2auth
with Ubuntu 18.04.4 LTS. All the hosts files are updated accordingly.
I assume you have absolutely no previous experience with any of the tools, but you have a basic understanding of what they do and you know your way around linux.
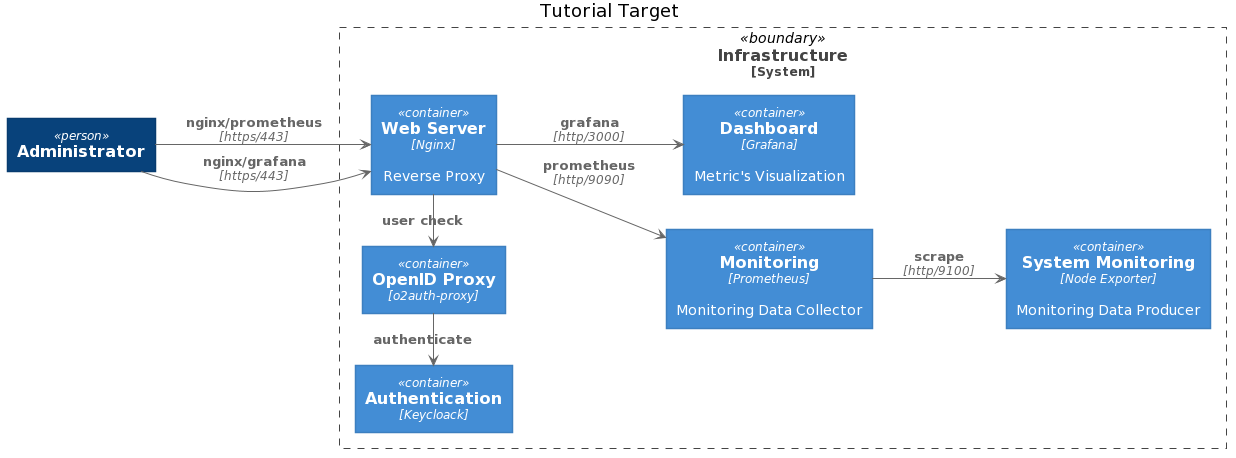
Goals
With this tutorial, we want to deploy the following environment
Installing Prometheus
You will install Prometheus version 2.19.1 / 2020-06-18, which is the latest one at the moment of writing.
Login onto prometheus and download it:
$ curl -LO https://github.com/prometheus/prometheus/releases/download/v2.19.1/prometheus-2.19.1.linux-amd64.tar.gz
Create the prometheus user, with no associated shell nor login rights:
$ sudo useradd --no-create-home --shell /bin/false prometheus
Create the binaries directory in /etc and the configuration files and data directory in /var/lib:
$ sudo mkdir /etc/prometheus
$ sudo mkdir /var/lib/prometheus
$ sudo chown prometheus:prometheus /etc/prometheus
$ sudo chown prometheus:prometheus /var/lib/prometheus
Extract the files:
$ tar xvf prometheus-2.19.1.linux-amd64.tar.gz
Copy the binaries in /usr/local/bin:
$ cd prometheus-2.19.1.linux-amd64
$ sudo cp prometheus /usr/local/bin/
$ sudo cp promtool /usr/local/bin/
$ sudo chown prometheus:prometheus /usr/local/bin/prometheus
$ sudo chown prometheus:prometheus /usr/local/bin/promtool
Copy the consoles and console_libraries directories to /etc/prometheus:
$ sudo cp -r consoles /etc/prometheus
$ sudo cp -r console_libraries /etc/prometheus
$ sudo chown -R prometheus:prometheus /etc/prometheus/consoles
$ sudo chown -R prometheus:prometheus /etc/prometheus/console_libraries
Clean up the environment:
$ cd ..
$ rm -rf prometheus-2.19.1.linux-amd64 prometheus-2.19.1.linux-amd64.tar.gz
Edit the Prometheus configuration file:
$ sudo vi /etc/prometheus/prometheus.yml
and insert the following information:
global:
  scrape_interval: 15s

scrape_configs:
  - job_name: 'prometheus'
    scrape_interval: 5s
    static_configs:
      - targets: ['localhost:9090']
This is quite straightforward: we are telling Prometheus to scrape its own metrics (job_name: 'prometheus') every 5 seconds (scrape_interval: 5s) and to serve its web console on port 9090.
Now set the file ownership:
$ sudo chown prometheus:prometheus /etc/prometheus/prometheus.yml
Start Prometheus and verify it is working:
$ sudo -u prometheus /usr/local/bin/prometheus --config.file /etc/prometheus/prometheus.yml --storage.tsdb.path /var/lib/prometheus/ --web.console.templates=/etc/prometheus/consoles --web.console.libraries=/etc/prometheus/console_libraries
Once you fix all the problems (the yaml configuration is usually problematic) and you are confident that everything is fine, stop the program and open a new systemd file:
$ sudo vi /etc/systemd/system/prometheus.service
and fill in the following:
[Unit]
Description=Prometheus
Wants=network-online.target
After=network-online.target

[Service]
User=prometheus
Group=prometheus
Type=simple
ExecStart=/usr/local/bin/prometheus \
--config.file /etc/prometheus/prometheus.yml \
--storage.tsdb.path /var/lib/prometheus/ \
--web.console.templates=/etc/prometheus/consoles \
--web.console.libraries=/etc/prometheus/console_libraries

[Install]
WantedBy=multi-user.target
Reload systemd:
$ sudo systemctl daemon-reload
start Prometheus:
$ sudo systemctl start prometheus
and verify it is running:
$ sudo systemctl status prometheus
● prometheus.service - Prometheus
Loaded: loaded (/etc/systemd/system/prometheus.service; disabled; vendor preset: enabled)
Active: active (running) since Fri 2020-06-26 14:18:50 UTC; 32s ago
Now enable the service to start on boot:
$ sudo systemctl enable prometheus
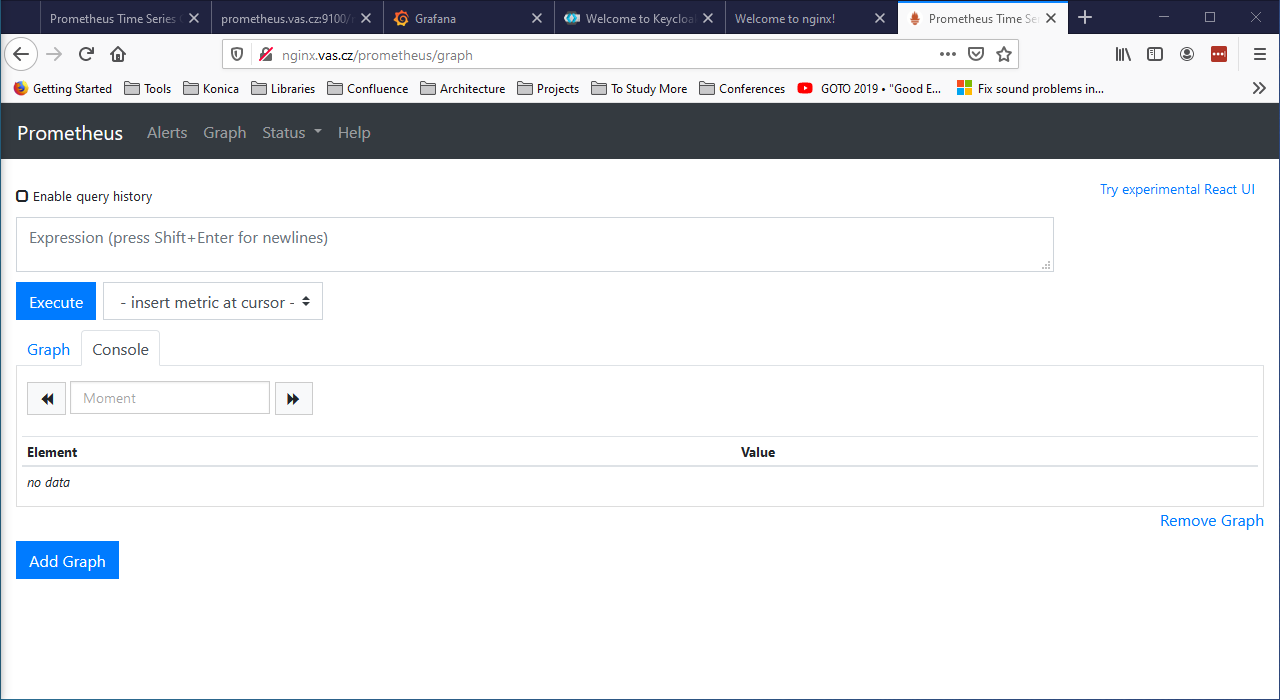
and reboot the server. If everything is fine, now you should be able to connect to Prometheus from the host targeting the endpoint prometheus:9090.
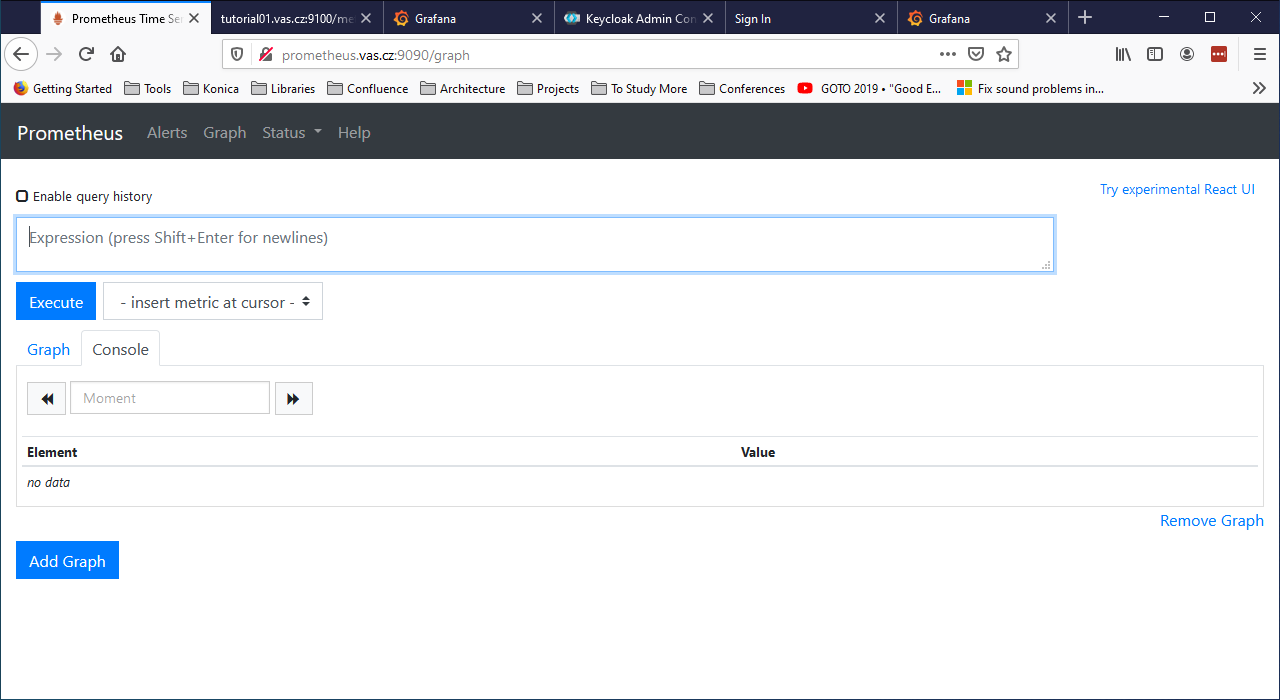
Note how Prometheus does not perfom any user’s authentication, which is not something you want when you move in production.
Activate Basic Server Monitoring
Prometheus provide a set of basic monitors for itself, but allows to retrieve monitoring information from other sources (called exporters). Let’s install one of this exporters, Node Exporter, which provides detailed information about the system, including CPU, disk and memory usage.
First of all let’s create the user:
$ sudo useradd --no-create-home --shell /bin/false node_exporter
Head to Prometheus Download Page and download the latest binaries. At the moment of writing, these are version 1.0.1 / 2020-06-15:
$ curl -LO https://github.com/prometheus/node_exporter/releases/download/v1.0.1/node_exporter-1.0.1.linux-amd64.tar.gz
Verify the signature:
$ sha256sum node_exporter-1.0.1.linux-amd64.tar.gz
Unpack the archive:
$ tar xvf node_exporter-1.0.1.linux-amd64.tar.gz
Copy the binaries to /usr/local/bin and set the right ownership:
$ sudo cp node_exporter-1.0.1.linux-amd64/node_exporter /usr/local/bin
$ sudo chown node_exporter:node_exporter /usr/local/bin/node_exporter
Remove the downloaded files:
$ rm -rf node_exporter-1.0.1.linux-amd64.tar.gz node_exporter-1.0.1.linux-amd64
Create the systemd service file for Node Exporter:
$ sudo vi /etc/systemd/system/node_exporter.service
Copy the following into the configuration file:
[Unit]
Description=Node Exporter
Wants=network-online.target
After=network-online.target

[Service]
User=node_exporter
Group=node_exporter
Type=simple
ExecStart=/usr/local/bin/node_exporter

[Install]
WantedBy=multi-user.target
Save the file and reload systemd:
$ sudo systemctl daemon-reload
Start the Node Exporter:
$ sudo systemctl start node_exporter
Verify it is running:
$ sudo systemctl status node_exporter
If everything is fine, enable Node Exporter to start on boot:
$ sudo systemctl enable node_exporter
Now let’s configure Prometheus to actually use Node Exporter for scraping metrics. Open the configuration file:
$ sudo vi /etc/prometheus/prometheus.yml
and add the following at the end of the scrape_configs section:
- job_name: 'tutorial01_node'
  scrape_interval: 5s
  static_configs:
    - targets: ['localhost:9100']
Note that you have to configure a different port than Prometheus scraping, because they are running on the same host.
Save the file and restart Prometheus:
$ sudo systemctl restart prometheus
Verify that everything is fine:
$ sudo systemctl status prometheus
Now from a client verify that you can access the server at the port 9100:
>curl tutorial01:9100
<html>
    <head><title>Node Exporter</title></head>
    <body>
        <h1>Node Exporter</h1>
        <p><a href="/metrics">Metrics</a></p>
    </body>
</html>
And finally reach the endpoint http://prometheus:9100/metrics from a browser: you should see the full range of metrics collected by the exporter.
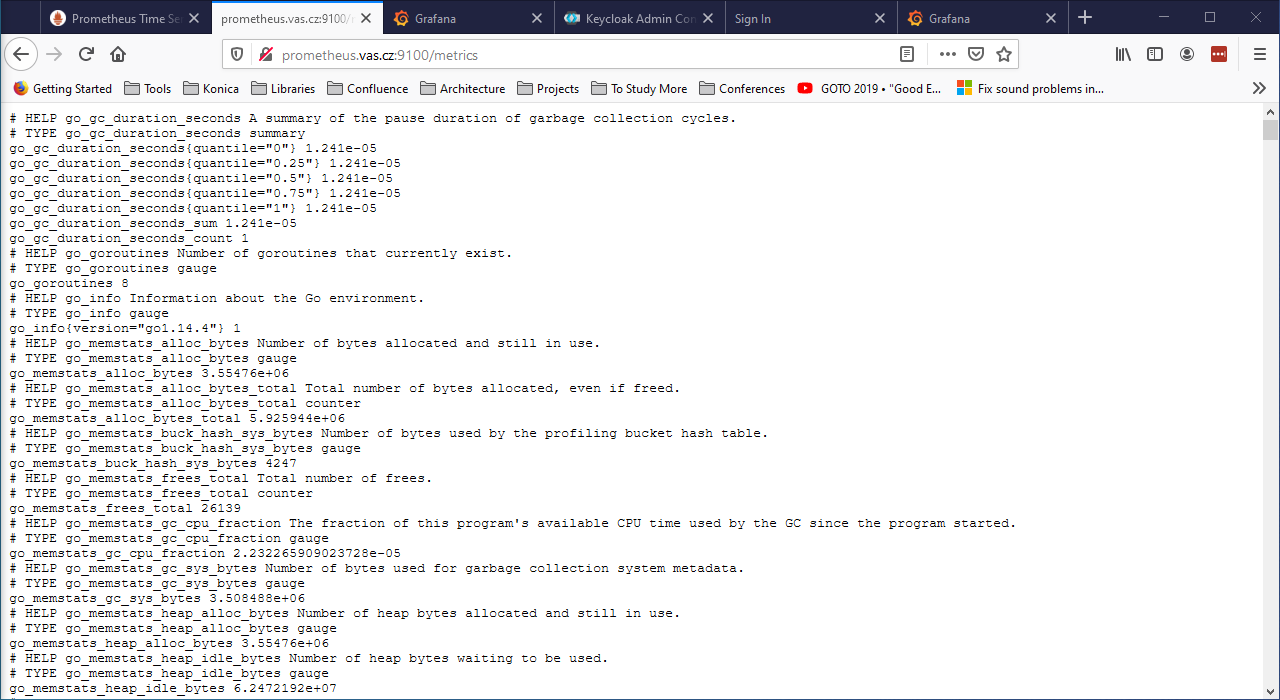
More extensive details are available on the Node Exporter README file.
Now reboot the server to verify that metrics load on boot too.
Install Grafana
Download the Grafana GPG key and pipe the output to apt-key:
$ wget -q -O - https://packages.grafana.com/gpg.key | sudo apt-key add -
Add the Grafana repository to your APT sources:
$ sudo add-apt-repository "deb https://packages.grafana.com/oss/deb stable main"
Refresh your APT cache to update your package list:
$ sudo apt update
$ sudo apt upgrade
Install Grafana:
$ sudo apt install grafana
Start the Grafana server:
$ sudo systemctl start grafana-server
Verify it is running:
$ sudo systemctl status grafana-server
Enable it to start on boot:
$ sudo systemctl enable grafana-server
Reboot your system and verify that Grafana is running after reboot by connecting to it on port 3000:
>curl tutorial01:3000
<a href="/login">Found</a>.
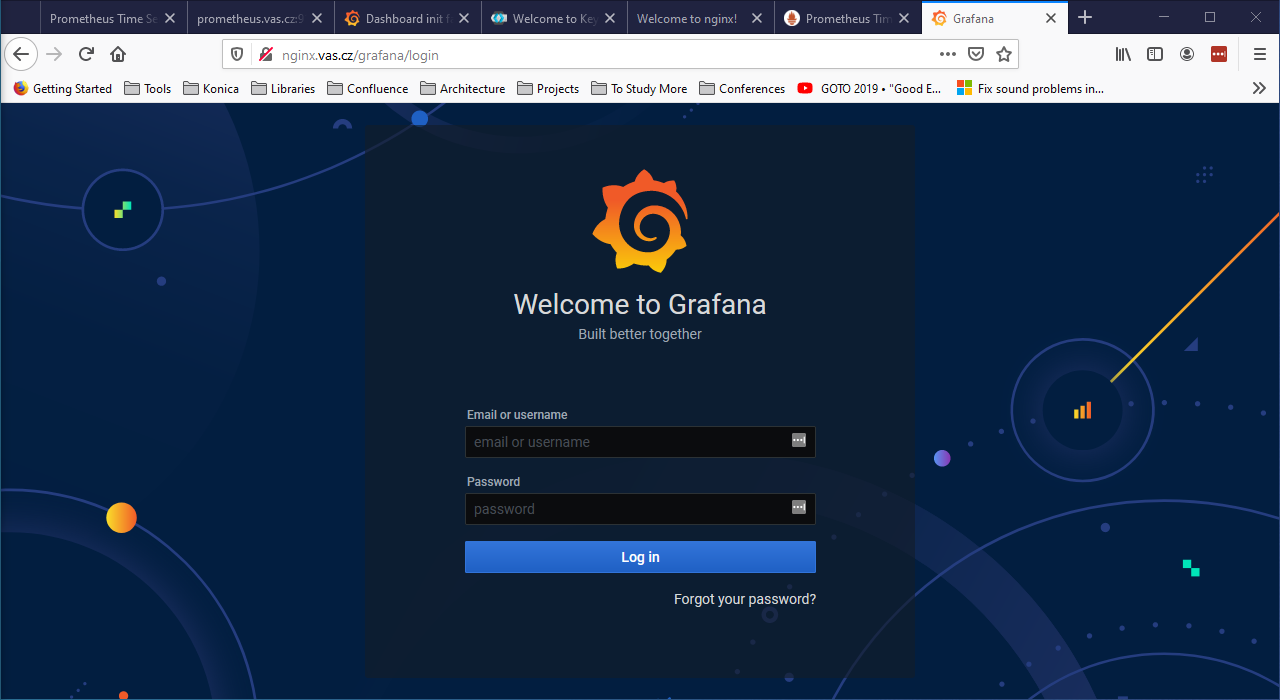
and finally targeting on the browser the endpoint http://grafana:3000.
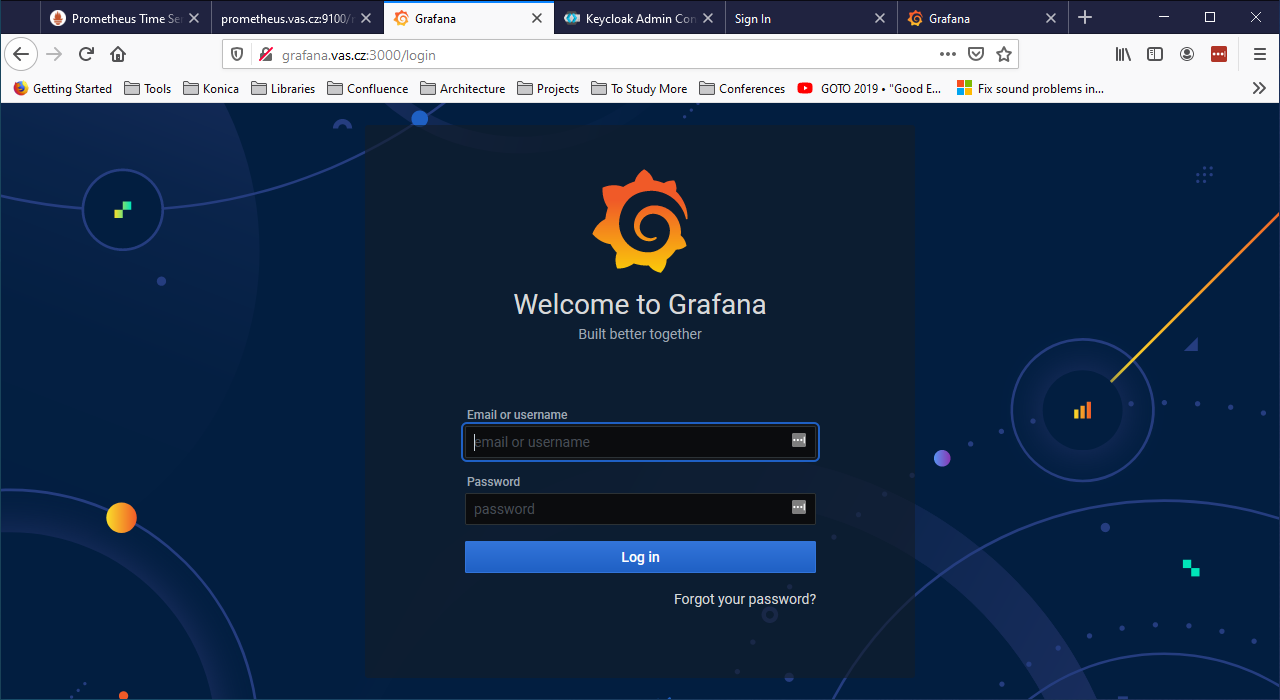
Note that Grafana provides basic authentication. The initial credentials are admin / admin and you will be prompted for change at the first login.
Installing Keycloak
The Keycloak server will be installed in a separate VM, in order to allow us to switch it and do comparison with other identity providers in future.
The VM will still be based on Ubuntu 18.0.4, with hostname keycloack and ip address 192.168.56.4. The etc/hosts file will be modified with these parameters.
First of all we need to install the Java 8 JDK prerequisite:
$ sudo apt update
$ java - version
If java is not currently installed install it:
$ sudo apt install openjdk-8-jdk-headless
Verify the installation:
$ java -version
$ javac -version
Download the installation package:
$ curl -LO https://downloads.jboss.org/keycloak/10.0.2/keycloak-10.0.2.tar.gz
$ sudo mv keycloak-10.0.2.tar.gz /opt/
$ cd /opt
$ sudo tar -xvzf keycloak-10.0.2.tar.gz
$ sudo mv keycloak-10.0.2 /opt/keycloak
$ sudo rm keycloak-10.0.2.tar.gz
Create the keycloak user and assign the right permissions:
$ sudo groupadd keycloak
$ sudo useradd --no-create-home --shell /bin/false keycloak
$ sudo chown -R keycloak: keycloak
$ sudo chmod o+x /opt/keycloak/bin/
Create a configuration directory for Keycloak under /etc:
$ cd /etc/
$ sudo mkdir keycloak
$ sudo cp /opt/keycloak/docs/contrib/scripts/systemd/wildfly.conf /etc/keycloak/keycloak.conf
$ sudo cp /opt/keycloak/docs/contrib/scripts/systemd/launch.sh /opt/keycloak/bin/
$ sudo chown keycloak: /opt/keycloak/bin/launch.sh
Now we need to correct the Keycloak installation path in launch.sh, so edit the file:
$ sudo vi /opt/keycloak/bin/launch.sh
and update the following line:
if [ "x$WILDFLY_HOME" = "x" ]; then
    WILDFLY_HOME="/opt/keycloak"
fi
Now copy the service definition file:
$ sudo cp /opt/keycloak/docs/contrib/scripts/systemd/wildfly.service /etc/systemd/system/keycloak.service
Open it and transform it as showed below:
[Unit]
Description=The Keycloak Server
After=syslog.target network.target
Before=httpd.service

[Service]
Environment=LAUNCH_JBOSS_IN_BACKGROUND=1
EnvironmentFile=-/etc/keycloak/keycloak.conf
User=keycloak
LimitNOFILE=102642
PIDFile=/var/run/keycloak/keycloak.pid
ExecStart=/opt/keycloak/bin/launch.sh $WILDFLY_MODE $WILDFLY_CONFIG $WILDFLY_BIND
StandardOutput=null

[Install]
WantedBy=multi-user.target
Reload systemd manager and enable Keycloak service on boot:
$ sudo systemctl daemon-reload
$ sudo systemctl enable keycloak
$ sudo systemctl start keycloak
$ sudo systemctl status keycloak
Create an initial admin account that can log into the master realm’s administration console so that we can start creating realms, users and registering applications to be secured by Keycloak. Since we are accessing the server from outside of localhost, we must create it using the bash script /opt/keycloak/bin/add-user-keycloak.sh:
$ sudo /opt/keycloak/bin/add-user-keycloak.sh -r master -u admin -p admin
$ sudo systemctl restart keycloak
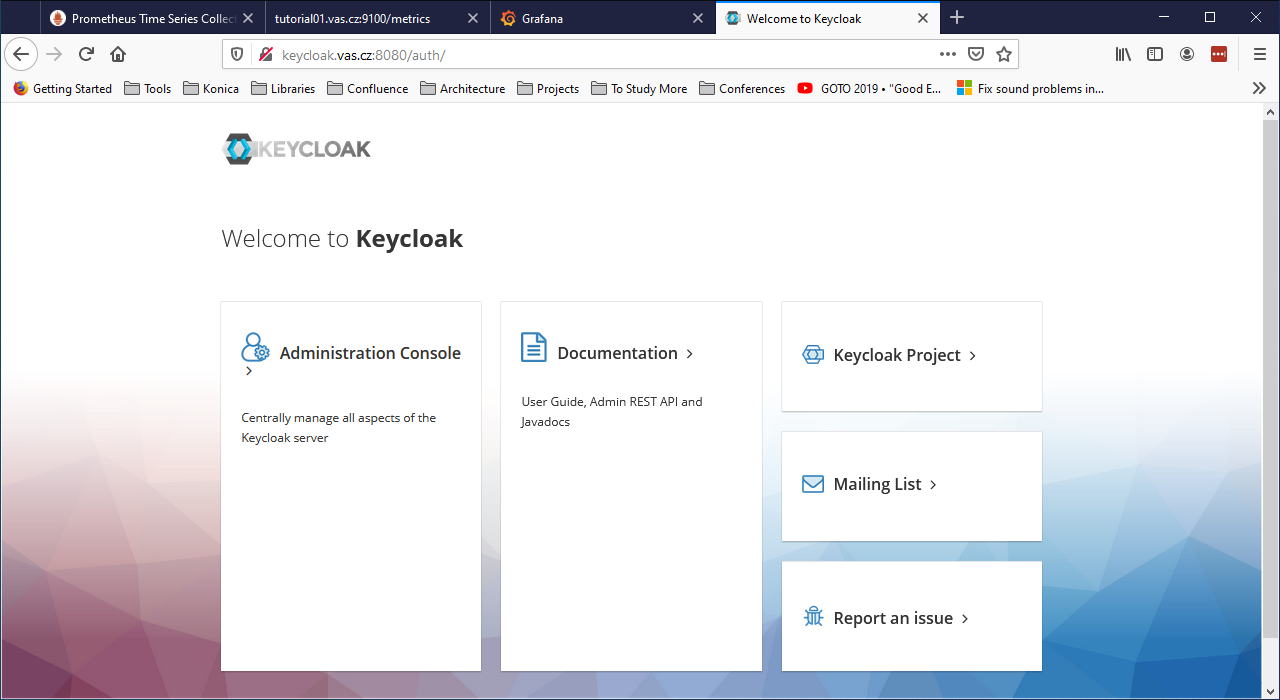
Now we can access the Keycloak server at http://keycloak:8080/auth/.
Install Nginx
Now let’s install Nginx on nginx as a reverse proxy to provide a security layer to Prometheus and Grafana:
$ sudo apt update
$ sudo apt upgrade
$ sudo apt install nginx
Check that Nginx is up and running:
$ sudo systemctl status nginx
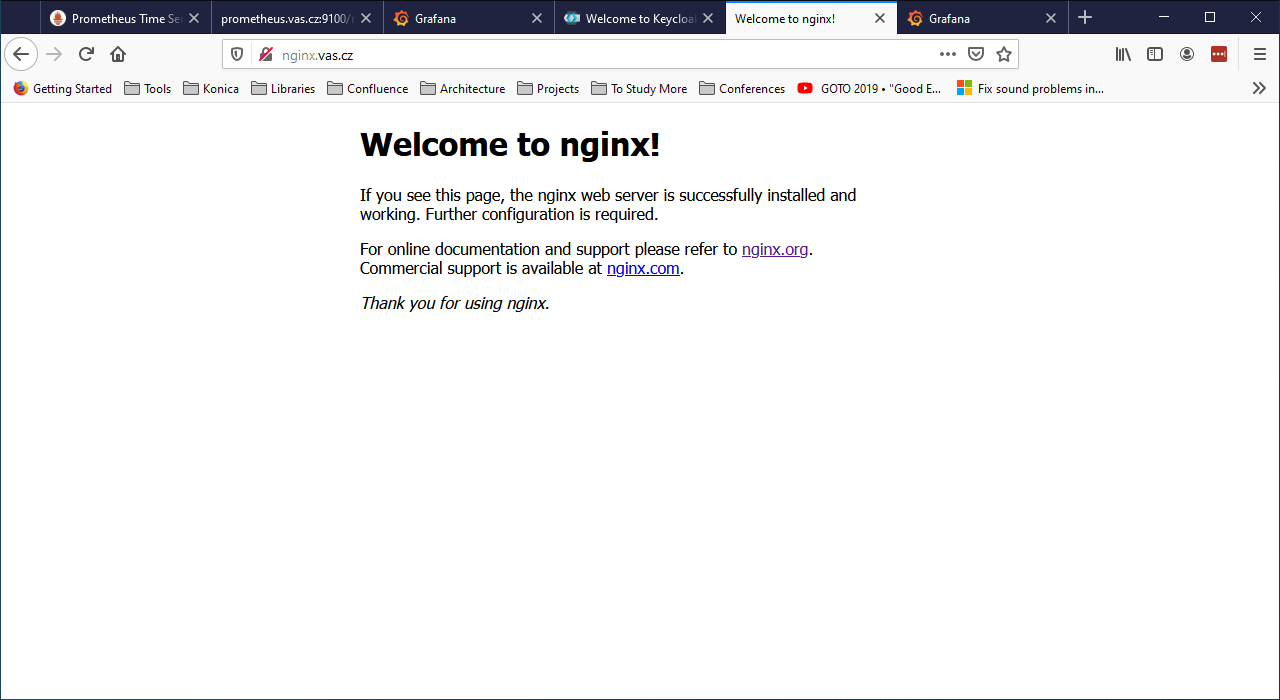
Test Nginx from a web browser. Connect to http://nginx. You should see the Welcome to nginx web page.
Reboot the server to be sure everything works as expected.
Activate SSL on Nginx
Create a Certification Authority
All communication should go through port 443. For that we need certificates. Since this is a testing environment we’ll create a Certification Authority to sign our own certificates.
For this task I’ll follow the tutorial Simple PKI, reserving to configure it better at a later time.
Login on ca, clone and rename the repository:
$ git clone https://bitbucket.org/stefanholek/pki-example-1
$ mv pki-example-1 cert
$ cd cert
$ mkdir -p ca/root-ca/private ca/root-ca/db crl certs
$ chmod 700 ca/root-ca/private
The ca directory holds CA resources, the crl holds CRLs, and the certs directory holds user certificates. Create the database:
$ cp /dev/null ca/root-ca/db/root-ca.db
$ cp /dev/null ca/root-ca/db/root-ca.db.attr
$ echo 01 > ca/root-ca/db/root-ca.crt.srl
$ echo 01 > ca/root-ca/db/root-ca.crl.srl
Edit etc/root-ca.conf and modify the following lines:
...
[ req ]
...
default_md = sha256
...
[ ca_dn ]
0.domainComponent       = "cz"
1.domainComponent       = "vas"
organizationName        = "KMLE"
organizationalUnitName  = "VAS CA"
commonName              = "KMLE VAS Test CA"
...
[ root_ca ]
...
default_md=sha256
...
Now create a private key and a certificate signing request (CSR) for the root CA. You will be asked for a passphrase to protect the private key:
$ openssl req -new -config etc/root-ca.conf -out ca/root-ca.csr -keyout ca/root-ca/private/root-ca.key
Verify the content of the two files ca/root-ca.csr and ca/root-ca/private/root-ca.key. Now we can self-sign our own certificate request:
$ openssl ca -selfsign -config etc/root-ca.conf -in ca/root-ca.csr -out ca/root-ca.crt -extensions root_ca_ext
The CA private key is stored in ~/cert/ca/root-ca/private/root-ca.key.
The CA self-signed certificate (the foundation for all trust relationship in the PKI) is stored in ~/cert/ca/root-ca.crt.
Create a Signing Authority
We will not use the root CA to sign certificates. For that we will create a Signing CA (SCA):
$ cd ~/cert
$ mkdir -p ca/signing-ca/private ca/signing-ca/db crl certs
$ chmod 700 ca/signing-ca/private
$ cp /dev/null ca/signing-ca/db/signing-ca.db
$ cp /dev/null ca/signing-ca/db/signing-ca.db.attr
$ echo 01 > ca/signing-ca/db/signing-ca.crt.srl
$ echo 01 > ca/signing-ca/db/signing-ca.crl.srl
Now edit ~/cert/etc/signing-ca.conf and change the following lines:
...
[ req ]
...
default_md = sha256
...
[ ca_dn ]
0.domainComponent = "cz"
1.domainComponent = "vas"
organizationName = "KMLE"
organizationalUnitName = "VAS Signing CA"
commonName = "KMLE VAS Test Signing CA"
...
[ signing_ca ]
...
default_md = sha256
...
x509_extensions = server_ext
...
Generate the certificate:
$ openssl req -new -config etc/signing-ca.conf -out ca/signing-ca.csr -keyout ca/signing-ca/private/signing-ca.key
$ openssl ca -config etc/root-ca.conf -in ca/signing-ca.csr -out ca/signing-ca.crt -extensions signing_ca_ext
Create a certificate for nginx
Edit the ~/cert/etc/server.conf and modify the following line:
...
[ req ]
...
default_md = sha256
...
Copy the file over to nginx:
$ scp ~/cert/etc/server.conf aizzi@nginx:~/
Now, on nginx create the CSR:
$ SAN=DNS:nginx openssl req -new -config ~/server.conf -out ~/nginx_vas_cz.csr -keyout ~/nginx_vas_cz.key
Generating a RSA private key
...................................+++++
...........................+++++
writing new private key to '/home/aizzi/nginx_vas_cz.key'
-----
You are about to be asked to enter information that will be incorporated
into your certificate request.
What you are about to enter is what is called a Distinguished Name or a DN.
There are quite a few fields but you can leave some blank
For some fields there will be a default value,
If you enter '.', the field will be left blank.
-----
1. Domain Component         (eg, com)       []:cz
2. Domain Component         (eg, company)   []:vas
3. Domain Component         (eg, pki)       []:.
4. Organization Name        (eg, company)   []:KMLE
5. Organizational Unit Name (eg, section)   []:VAS
6. Common Name              (eg, FQDN)      []:nginx
Copy the CSR back to ca:
$ scp ~/nginx_vas_cz.csr aizzi@ca:~/cert/certs
Back on ca sign the request and create the certificate:
$ openssl ca -config etc/signing-ca.conf -in certs/nginx_vas_cz.csr -out certs/nginx_vas_cz.crt -extensions server_ext
Now send the certificate back to nginx:
$ scp ~/cert/certs/nginx_vas_cz.crt aizzi@nginx:~/
Activate TLS on Nginx
Now let’s use the generated certificate to enable TLS on Nginx. Login to nginx:
$ sudo mkdir /etc/nginx/ssl
$ sudo cp nginx_vas_cz.crt /etc/nginx/ssl
$ sudo cp nginx_vas_cz.key /etc/nginx/ssl
$ sudo ls -la /etc/nginx/ssl
Now edit the configuration file /etc/nginx/sites-available/default and modify it in the following way:
...
server {
        #listen 80 default_server;
        #listen [:]:80 default_server;

        # SSL configuration
        listen 443 ssl default_server;
        listen [:]:443 ssl default_server;
        ssl_certificate /etc/nginx/ssl/nginx_vas_cz.crt;
        ssl_certificate_key /etc/nginx/ssl/nginx_vas_cz.key;
...
Restart Nginx:
$ sudo systemctl restart nginx
Now hit the endpoint https://nginx and you should get a warning, because the certificate authority is not recognized.
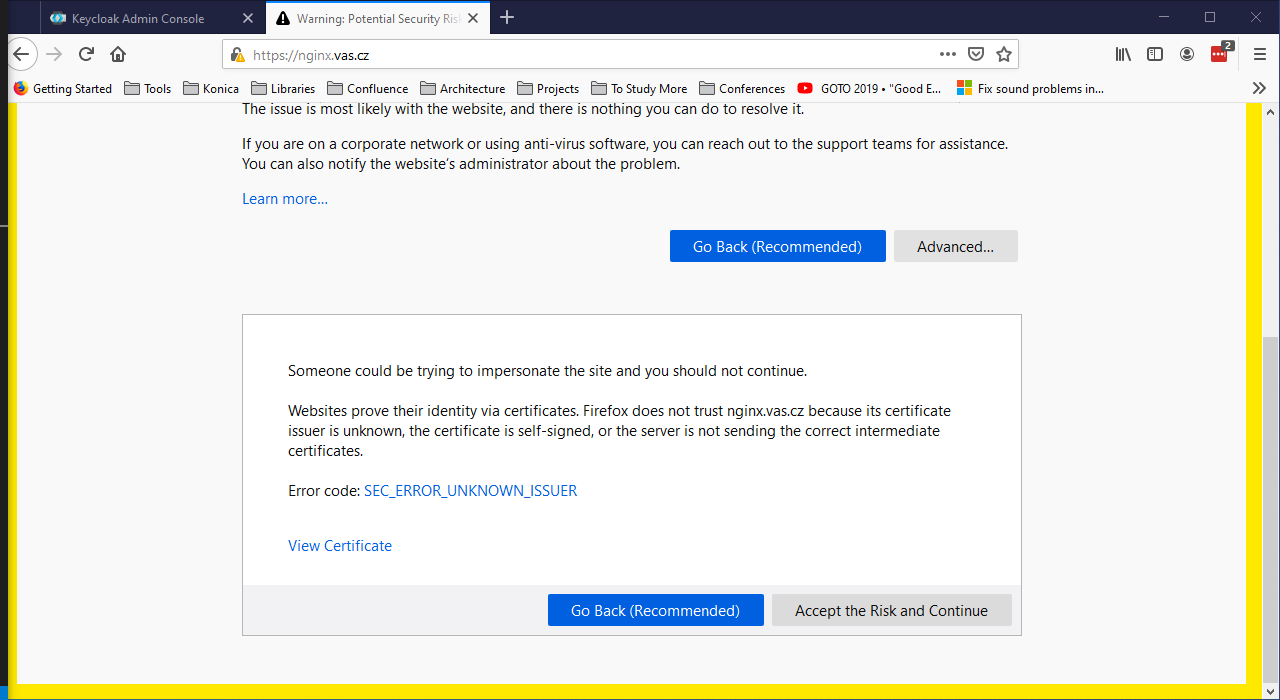
This is completely fine, because our CA is not trusted outside of our local environment. So, we need to add it to the list of our trusted CA. The way to do this varies depending on the environment. For example, to add it on Firefox we can follow the Setting Up Certificate Authorities (CAs) in Firefox tutorial, which will import them from the OS list of authorized CAs.
We’ll follow another path. Download the Signing CA’s certificate on the client you want to connect from:
> scp aizzi@ca:~/cert/ca/signing-ca.crt .
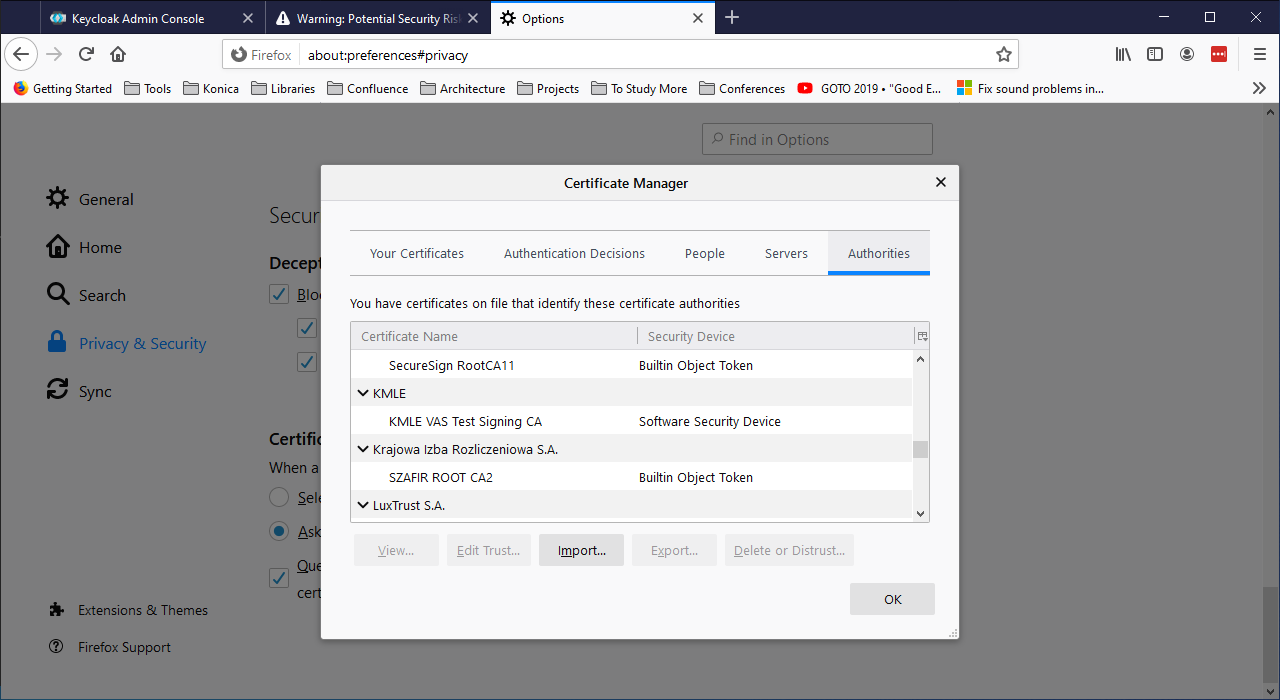
Now open the privacy preferences on Firefox:
about:preferences#privacy
Scroll down to the Certificates section and click on View Certificates. Select the Authorities tab. Click Import, select the download certificate and open it. On the Downloading Certificate panel select Trust this CA to identify websites and click OK. Now the root CA is a trusted one.
From this point on, Firefox should not complain anymore about KMLE issued certificates. To verify this, connect again to https://nginx. You should not receive any error now.
Also, note that we have disabled the listener on port 80, so you should not be able to connect using http.
Activate reverse proxy
Now, let’s activate two endpoints to reach Prometheus and Grafana via Nginx.
Login on nginx and save the default configuration file for backup:
$ sudo cp /etc/nginx/sites-available/default /etc/nginx/sites-available/default.0
Next, edit the configuration file:
$ sudo vi /etc/nginx/sites-available/default
and modify it in the following way:
server {
        listen 443 ssl default_server;
        # listen [:]:443 ssl default_server;

        ssl_certificate /etc/nginx/ssl/nginx_vas_cz.crt;
        ssl_certificate_key /etc/nginx/ssl/nginx_vas_cz.key;

        root /var/www/html;

        # Add index.php to the list if you are using PHP
        index index.html index.htm index.nginx-debian.html;

        server_name _;

        location / {
                # First attempt to serve request as file, then
                # as directory, then fall back to displaying a 404.
                try_files $uri $uri/ =404;
        }

        location /prometheus/ {
                proxy_pass http://prometheus:9090/;
        }

        location /grafana/ {
                proxy_pass http://grafana:3000/;
        }
}
Check the new configuration and restart Nginx:
$ sudo nginx -t
$ sudo systemctl reload nginx
When running Prometheus behind the Nginx proxy, you’ll need to set the external URL to http://nginx/prometheus and the route prefix to /. On prometheus Open the prometheus.service configuration file:
$ sudo vi /etc/systemd/system/prometheus.service
and modify it in the following way:
[Unit]
Description=Prometheus
Wants=network-online.target
After=network-online.target

[Service]
User=prometheus
Group=prometheus
Type=simple
ExecStart=/usr/local/bin/prometheus \
--config.file /etc/prometheus/prometheus.yml \
--storage.tsdb.path /var/lib/prometheus/ \
--web.console.templates=/etc/prometheus/consoles \
--web.console.libraries=/etc/prometheus/console_libraries \
--web.external-url=http://nginx/prometheus/ \
--web.route-prefix="/"

[Install]
WantedBy=multi-user.target
and restart the service:
$ sudo systemctl daemon-reload
$ sudo systemctl start prometheus
$ sudo systemctl status prometheus
Now hit the endpoint https://nginx/prometheus and you should be correctly redirected.
Now configure Grafana to run behind the proxy. Login on grafana and edit the Grafana configuration file:
$ sudo vi /etc/grafana/grafana.ini
and change the following lines:
root_url = %(protocol)s://%(domain)s:%(http_port)s/grafana/
serve_from_sub_path = true
Save the file and restart Grafana:
$ sudo systemctl stop grafana-server
$ sudo systemctl start grafana-server
$ sudo systemctl status grafana-server
Now hit the endpoint https://nginx/grafana and you should be correctly redirected.
Enable Authentication for Prometheus
Now, let’s provide authentication behind Nginx. We will use OAuth2-Proxy for this purpose.
Login on oauth and download the binaries:
$ curl -LO https://github.com/oauth2-proxy/oauth2-proxy/releases/download/v6.0.0/oauth2-proxy-v6.0.0.linux-amd64.go1.14.2.tar.gz
$ tar xvf oauth2-proxy-v6.0.0.linux-amd64.go1.14.2.tar.gz
$ mv oauth2-proxy-v6.0.0.linux-amd64.go1.14.2 oauth2
$ rm oauth2-proxy-v6.0.0.linux-amd64.go1.14.2.tar.gz
Follow the Keycloak Auth Provider configuration guide:
Valid Redirect URI = https://nginx/oauth2/callback
Secret = 0e7fc0a2-0ed5-4147-8ce5-dd479b90c445
Note : you must replace the above secret with your own. I choose to leave it here to guide you through the next steps. It is not really a problem, because this environment leaves only on my laptop and is already gone for good.
These are the parameters to set:
--provider=keycloak
--client-id=oauth2
--client-secret=0e7fc0a2-0ed5-4147-8ce5-dd479b90c445
--login-url="http://keycloak:8080/auth/realms/tutorial01/protocol/openid-connect/auth"
--redeem-url="http://keycloak:8080/auth/realms/tutorial01/protocol/openid-connect/token"
--validate-url="http://keycloak:8080/auth/realms/tutorial01/protocol/openid-connect/userinfo"
--keycloak-group=/admin
--email-domain=*
--cookie-secret=1234567890123456
--http-address="http://192.168.56.8:4180"
--scope=openid
On Keycloak create the group admin. Next, create a user and add her to the group admin. This is the user that you will use later to login into Prometheus.
Now, start the proxy with the following command:
$ ./oauth2/oauth2-proxy --provider=keycloak --client-id=oauth2 --client-secret=0e7fc0a2-0ed5-4147-8ce5-dd479b90c445 --login-url="http://keycloak:8080/auth/realms/tutorial01/protocol/openid-connect/auth" --redeem-url="http://keycloak:8080/auth/realms/tutorial01/protocol/openid-connect/token" --validate-url="http://keycloak:8080/auth/realms/tutorial01/protocol/openid-connect/userinfo" --keycloak-group=/admin --email-domain=* --cookie-secret=1234567890123456 --http-address="http://192.168.56.8:4180" --scope=openid
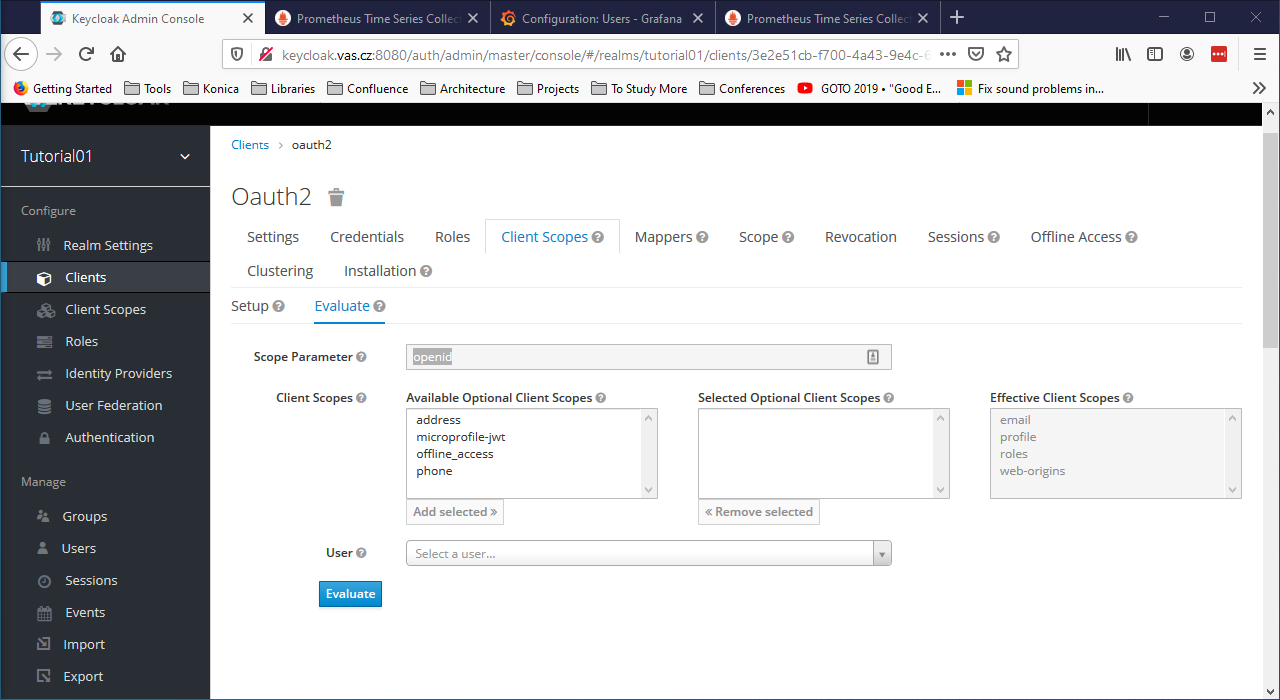
Pay attention to the last parameter --scope=openid. You can get this value from the Client Scopes tab of the Oauth2 client in Keycloak.
We will use the Nginx auth_request directive to allow Nginx to authenticate requests via the oauth2_proxy’s /auth endpoint, which only returns a 202 Accepted response or a 401 Unauthorized response without proxying the request through.
Login on nginx and edit the default file:
$ sudo cp /etc/nginx/sites-available/default /etc/nginx/sites-available/default.1
$ sudo vi /etc/nginx/sites-available/default
and modify it in the following way:
server {
        listen 443 ssl default_server;
        # listen [:]:443 ssl default_server;

        ssl_certificate /etc/nginx/ssl/nginx_vas_cz.crt;
        ssl_certificate_key /etc/nginx/ssl/nginx_vas_cz.key;

        root /var/www/html;

        # Add index.php to the list if you are using PHP
        index index.html index.htm index.nginx-debian.html;

        server_name _;

        location / {
                # First attempt to serve request as file, then
                # as directory, then fall back to displaying a 404.
                try_files $uri $uri/ =404;
        }

        location /prometheus/ {
                auth_request /oauth2/auth;
                error_page 401 = /oauth2/sign_in;

                # pass information via X-User and X-Email headers to backend,
                # requires running with --set-xauthrequest flag
                auth_request_set $user $upstream_http_x_auth_request_user;
                auth_request_set $email $upstream_http_x_auth_request_email;
                proxy_set_header X-User $user;
                proxy_set_header X-Email $email;

                # if you enabled --cookie-refresh, this is needed for it to work with auth_request
                # auth_request_set $auth_cookie $upstream_http_set_cookie;
                # add_header Set-Cookie $auth_cookie;

                proxy_pass http://prometheus:9090/;
        }

        location /grafana/ {
                proxy_pass http://grafana:3000/;
        }

        location /oauth2/ {
                proxy_pass http://oauth:4180;
                proxy_set_header Host $host;
                proxy_set_header X-Real-IP $remote_addr;
                proxy_set_header X-Scheme $scheme;
                proxy_set_header X-Auth-Request-Redirect $request_uri;
        }

        location = /oauth2/auth {
                proxy_pass http://oauth:4180;
                proxy_set_header Host $host;
                proxy_set_header X-Real-IP $remote_addr;
                proxy_set_header X-Scheme $scheme;
                # nginx auth_request includes headers but not body
                proxy_set_header Content-Length "";
                proxy_pass_request_body off;
        }
}
Restart nginx and hit the endpoint http://nginx/prometheus/. This time you will get the request to authenticate with Keycloak
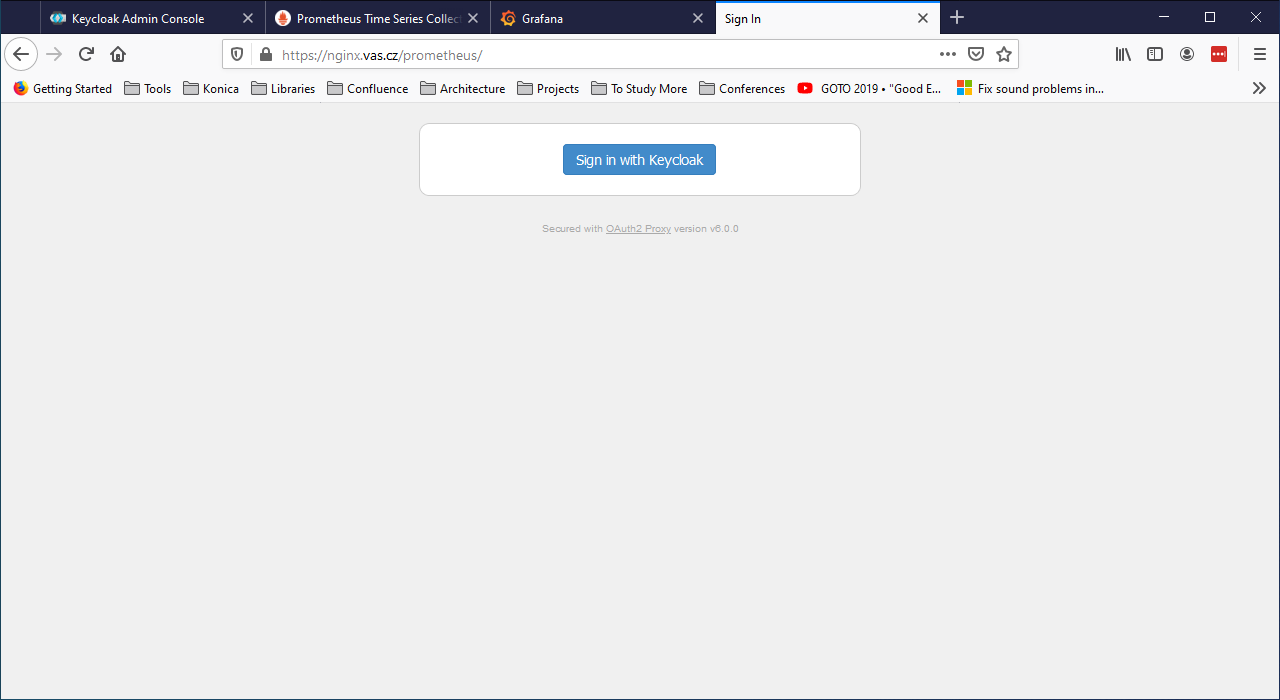
followed by the customized login page
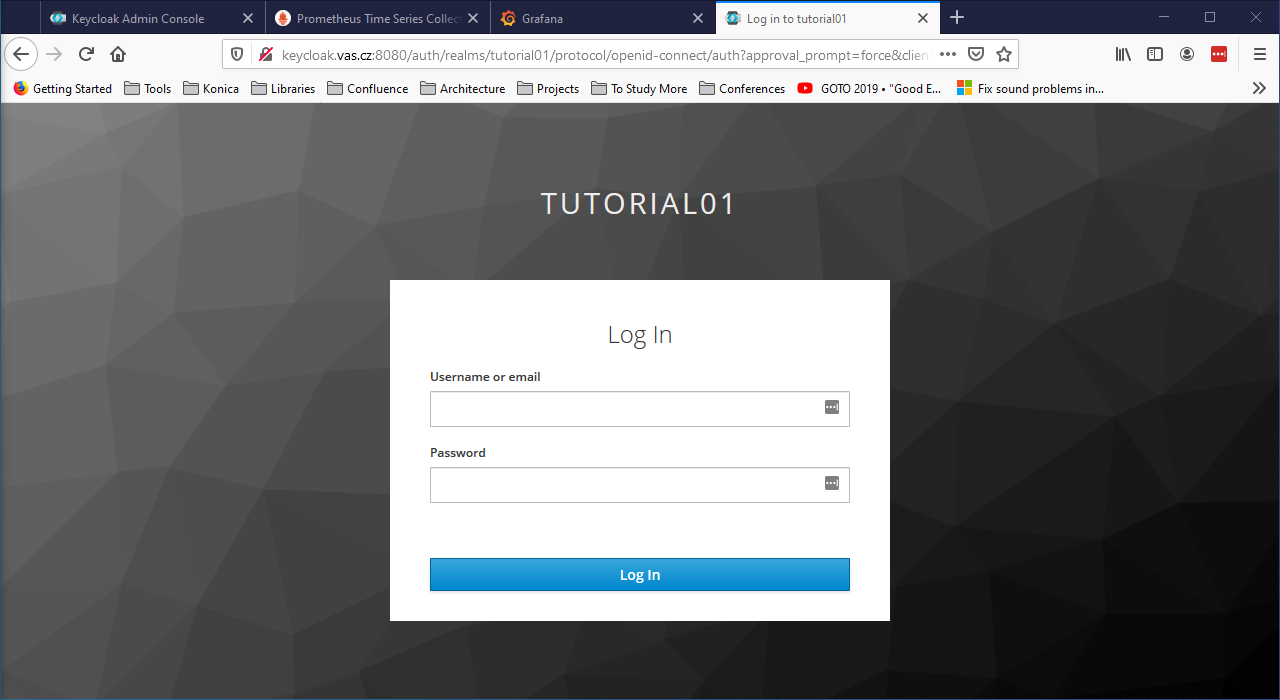
Login with user you defined before, and you should be redirected to Prometheus
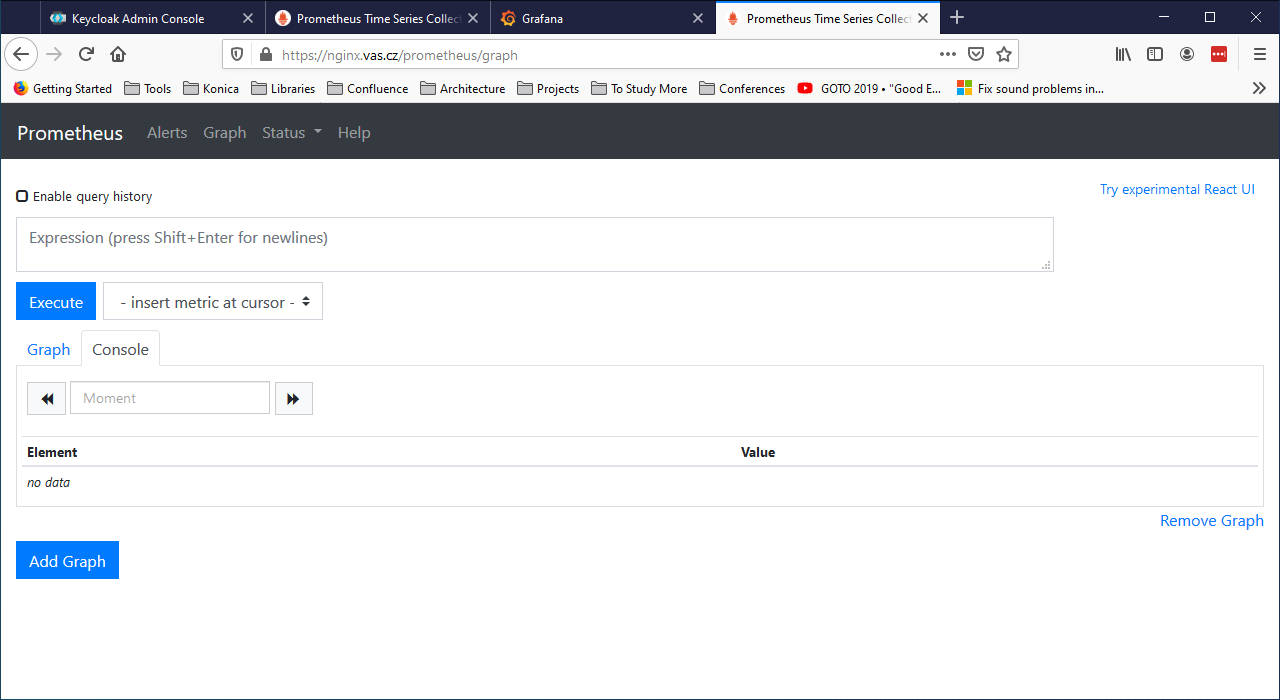
Note that any further attempt to connect to Prometheus will not trigger the request for login, because the user is already authorized.
Enabling Grafana Login via Keycloak
The idea is to let Nginx, Oauth2-Proxy and Keycloak to handle the authentication, serving the result to Grafana.
The starting point is the Auth Proxy Authentication page of Grafana documentation.
Login to grafana and edit the configuration file /etc/grafana/grafana.ini:
$ sudo cp /etc/grafana/grafana.ini /etc/grafana/grafana.ini.0
$ sudo vi /etc/grafana/grafana.ini
Found the Auth Proxy section and modify it in the following way:
[...]

#################################### Users ###############################
[users]
allow_sign_up = false
auto_assign_org = true
auto_assign_org_id = 1
auto_assign_org_role = Admin

[...]

[auth]
login_cookie_name = _oauth2_proxy
disable_login_form = true
disable_signout_menu = true
oauth_auto_login = true

[...]

#################################### Basic Auth ##########################
[auth.basic]
enabled = false

#################################### Auth Proxy ##########################
[auth.proxy]
enabled = true
header_name = X-Username
header_property = username
auto_sign_up = true
sync_ttl = 60
whitelist = 192.168.56.0/24
headers = Email:X-User-Email, Name:X-User-Name
# Read the auth proxy docs for details on what the setting below enables
;enable_login_token = false

[...]
Restart grafana to load the changes.
Restart the oauth2_proxy with the added parameter --set-xauthrequest:
$ ./oauth2/oauth2-proxy --provider=keycloak --client-id=oauth2 --client-secret=0e7fc0a2-0ed5-4147-8ce5-dd479b90c445 --login-url="http://keycloak:8080/auth/realms/tutorial01/protocol/openid-connect/auth" --redeem-url="http://keycloak:8080/auth/realms/tutorial01/protocol/openid-connect/token" --validate-url="http://keycloak:8080/auth/realms/tutorial01/protocol/openid-connect/userinfo" --keycloak-group=/admin --email-domain=* --cookie-secret=1234567890123456 --http-address="http://192.168.56.8:4180" --scope=openid --set-xauthrequest=true
Next, login on nginx:
$ sudo cp /etc/nginx/sites-available/default /etc/nginx/sites-available/default.5
$ sudo vi /etc/nginx/sites-available/default
and modify the grafana section in the following way:
location /grafana/ {
        auth_request /oauth2/auth;
        error_page 401 = /oauth2/sign_in;

        # pass information about the user to the backend
        # requires oauth2-proxy to run with --set-xauthrequest flag
        auth_request_set $user $upstream_http_x_auth_request_preferred_username;
        auth_request_set $email $upstream_http_x_auth_request_email;
        auth_request_set $name $upstream_http_x_auth_request_user;
        proxy_set_header X-Username $user;
        proxy_set_header X-User-Email $email;
        proxy_set_header X-User-Name $name;

        proxy_pass http://grafana:3000/;
}
Restart nginx and hit the endpoint https://nginx/grafana.
ATTENTION
At the moment of writing is seems there is a problem with the $upstream_http_x_auth_request_preferred_username and $upstream_http_x_auth_request_user. I am unable to get their value, while I have no problem in retrieving the value of $upstream_http_x_auth_request_email. I have opened an issue to check the problem.
Meanwhile, as a workaround, I’m using the email as a proxy for the Grafana user. This means, I have modified the above example in the following way.
In the grafana.ini file:
#################################### Auth Proxy ##########################
[auth.proxy]
enabled = true
header_name = X-Username
header_property = email
In the nginx configuration:
proxy_set_header X-Username $email
This also means that the Keycloak user MUST have the email field filled or you will not be able to login in Grafana (you will get the splash screen without being logged in).